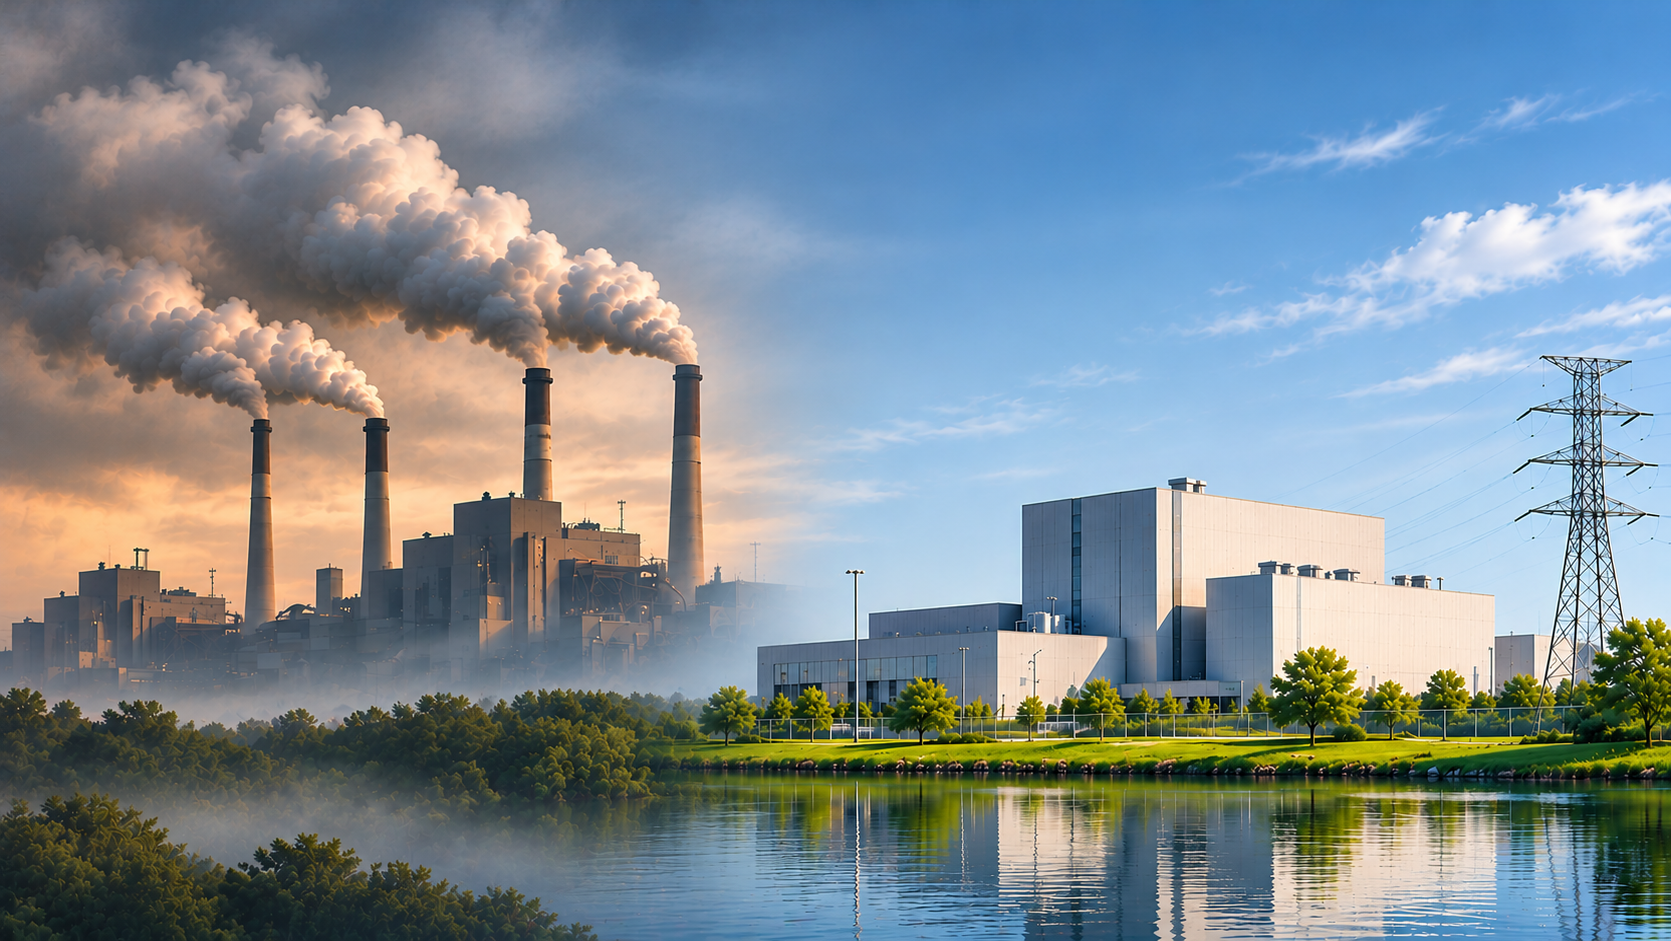
Everyone’s heard of the carbon footprint of different energy sources, the largest footprint belonging to coal. Each kilowatt-hour (kWh) of energy produced from coal emits about 900 grams of CO2. Nuclear has the smallest carbon footprint with only 6 grams emitted per kWh, and that mainly from concrete production, construction, and mining of steel and uranium. Wind, hydro and solar are not too far behind (11, 24 and 48 grams, respectively), for the same reasons. Biomass is supposedly carbon neutral as it sucks CO2 out of the atmosphere before it liberates it again later, although production losses are significant depending upon the biomass, and generally offset any real gains in carbon emissions (UNECE 2021), ending up with an average of 230 grams emitted per kWh produced.
Carbon emissions and physical footprints are known as externalities and are those vague someone-has-to-pay-eventually kind of thing it’s hard to put a value on. Proposed carbon footprint taxes are in the range of $15 to $40/ton of CO2 emitted, but assigning a physical footprint cost depends on the region, ecosystem sensitivities and importance. A hundred-acre wetlands to be flooded by a new dam is worth more to the planet than a hundred-acre strip under a solar array in a desert.
But an energy’s death print, as it is called, is rarely discussed. The death print is the number of people killed by one kind of energy or another per kWh produced and, like the carbon footprint, coal is the worst and nuclear is the best (WHO 2025). According to the World Health Organization, the Centers for Disease Control, the National Academy of Science and many health studies over the last decade (NAS 2010; Our World in Data), the adverse impacts on health become a significant effect for fossil fuel and biofuel/biomass sources. In fact, the WHO has called biomass burning in developing countries a major global health issue because of poor ventilation (WHO 2025).
The table below lists the mortality rate of each energy source as deaths per trillion kWhrs produced. The numbers are a combination of actual direct deaths and epidemiological estimates, and are rounded to two significant figures. It is critical to not use numbers from the Linear-No-Threshold hypothesis which has been shown to be incorrect.
Energy Source Mortality Rate (deaths/trillionkWh)
Coal – global average 100,000 (33% global electricity)
Coal – China 150,000 (50% China’s electricity)
Coal – U.S. 10,000 (19% U.S. electricity)
Oil 30,000 (36% of energy, 2% of electricity)
Biofuel/Biomass 24,000 (9% global energy)
Natural Gas 4,000 (22% global electricity, 45% of U.S.)
Solar (rooftop) 440 (9% global electricity)
Wind 150 (9% global electricity)
Hydro – global average 1,400 (14% global electricity)
Hydro – U.S. 0.1 (7% of U.S. electricity)
Nuclear – global average 40 (9% global electricity w/Chern&Fukush)
Nuclear – U.S. 0.1 (19% of U.S. electricity)
well as total health care costs (courtesy of EERE).
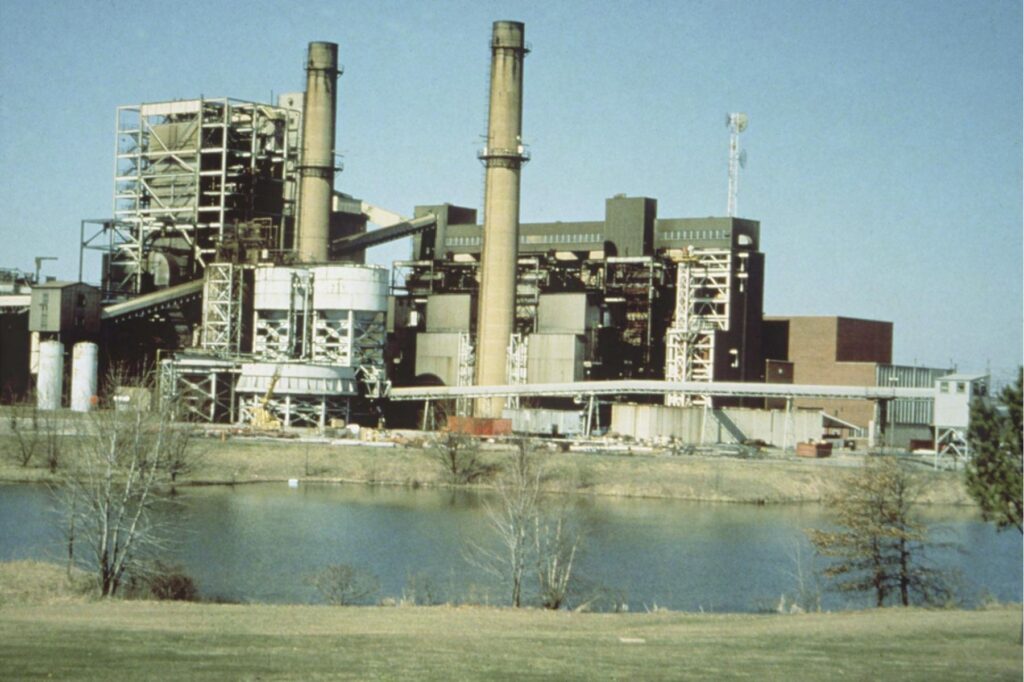
For fossil fuels and biomass, it is carbon particulates resulting from burning that cause upper respiratory distress, kind of a second-hand black lung. Our lungs just don’t like breathing in burnt carbonaceous particulates, whether from coal or wood or manure or pellets or cigarettes. The numbers of deaths in China from coal are so high because they have ramped up coal so fast in the last 30 years. The impact on their health care system has been significant in not just deaths, but in non-lethal health effects and lost days of work.
It is notable that the U.S. death rates for coal are so much lower than for China, strictly as a result of regulation such as the Clean Air Act. It is also notable that the Clean Air Act is one of the most life-saving pieces of legislation ever adopted by any country in history. Still, about 10,000 die from coal use in the U.S. each year, and another thousand from natural gas. Hydro is dominated by a few rare large dam failures outside the United States, like Banqiao in China in 1976 which killed about 171,000 people. Workers still regularly fall off wind turbines during maintenance but since relatively little electricity production comes from wind, the total deaths are small.
Nuclear and hydro in the United States have the lowest death print, even with the worst-case Chernobyl numbers and Fukushima projections, and uranium mining deaths. The few U.S. deaths in nuclear have all been in the weapons complex or are from normal industrial accidents like falling off scaffolding, nothing to do with nuclear power itself. The reason the nuclear and hydro numbers are so small is that they produce so much electricity per reactor or dam, are so highly regulated, and are so inherently safe, especially the new nuclear designs like FANCO’s EAGL-1.
Speaking of the EAGL-1, this reactor is designed to prevent severe accidents principally through reduction of stored energy, inherent negative reactivity feedback, retention of the primary coolant inventory, passive decay heat removal, and multiple barriers to radionuclide release. The near-atmospheric-pressure of the lead-bismuth eutectic (LBE) primary coolant system prevents high-pressure leaks and energetic coolant-water reactions, while the high boiling temperature (~1,670°C, 1,000°C above the operating temperature), the large thermal inertia of LBE and it’s relatively non-reactive chemistry, provide substantial time and temperature margins if the system begins to change. Following loss of forced flow or electrical power, the EAGL-1 will shut down, control rods will be inserted, and the system will transition to a natural-circulation cooling and passive heat rejection, without dependence on active emergency injection or any human’s specific actions. A guard vessel, below-grade nuclear island (buried below the soil surface), functional containment barriers, and mechanistic retention of radionuclides within the LBE provide successive layers of defense against any release.

over the last 30 years. Tiananmen Square Source: NREL, Simon Tsuo
Although it is difficult to assign a cost to these death rates, estimates have suggested there is at least a 10% increase in health care costs in countries where coal makes up a significant fraction of the energy mix, like the U.S., China and Europe (NAS 2010; Cohen et al., 2005; Pope et al., 2002). These additional health costs begin to rival the total energy costs on an annual basis for the U.S. given that health care costs exceed $5 trillion, and electricity costs only exceed about $500 billion. Another way to describe this human health energy fee is that it costs about 2,000 lives per year to keep the lights on in Beijing but only about 50 lives to keep them on in Indianapolis.
So until we ramp nuclear up to 50% or more of our electricity, I guess that’s just the cost of doing business…
References: P. Bickel and R. Friedrich, Externalities of Energy, European Union Report EUR 21951, Luxembourg (2005)
A. J. Cohen et al., The global burden of disease due to outdoor air pollution, Journal of Toxicology and Environmental Health, Part A, 68: 1301-1307 (2005)
NAS, Hidden Costs of Energy: Unpriced Consequences of Energy Production and Use Committee on Health, Environmental, and Other External Costs and Benefits of Energy Production and Consumption; Nat. Res. Council, Wash., D.C. ISBN: 0-309-14641-0 (2010).
C. A. Pope et al., Lung cancer, cardiopulmonary mortality, and long-term exposure to fine particulate air pollution. Journal of the AMA, 287 (9): 1132-1141 (2002).
J. Scott et al., The Clean Air Act at 35, Environmental Defense, New York, www.environmentaldefense.org. (2005). WHO 2007, Health effects of chronic exposure to smoke from Biomass Fuel burning in rural areas, Chittaranjan National Cancer Institute cnci.academia.edu/1123846/
WHO 2025, Household air pollution https://www.who.int/en/news-room/fact-sheets/detail/household-air-pollution-and-health
UNECE 2021 report Life Cycle Assessment of Electricity Generation Options https://www.researchgate.net/publication/356973026_Life_cycle_assessment_of_electricity_generation_options